Shocking new figures reveal just how much of health cut the Annastacia Palaszczuk Government has made since she became Premier.
The figures from a parliamentary Question on Notice show efficiency and productivity dividends slapped on Queensland hospitals have resulted in more than a billion dollars being cut from the health system.
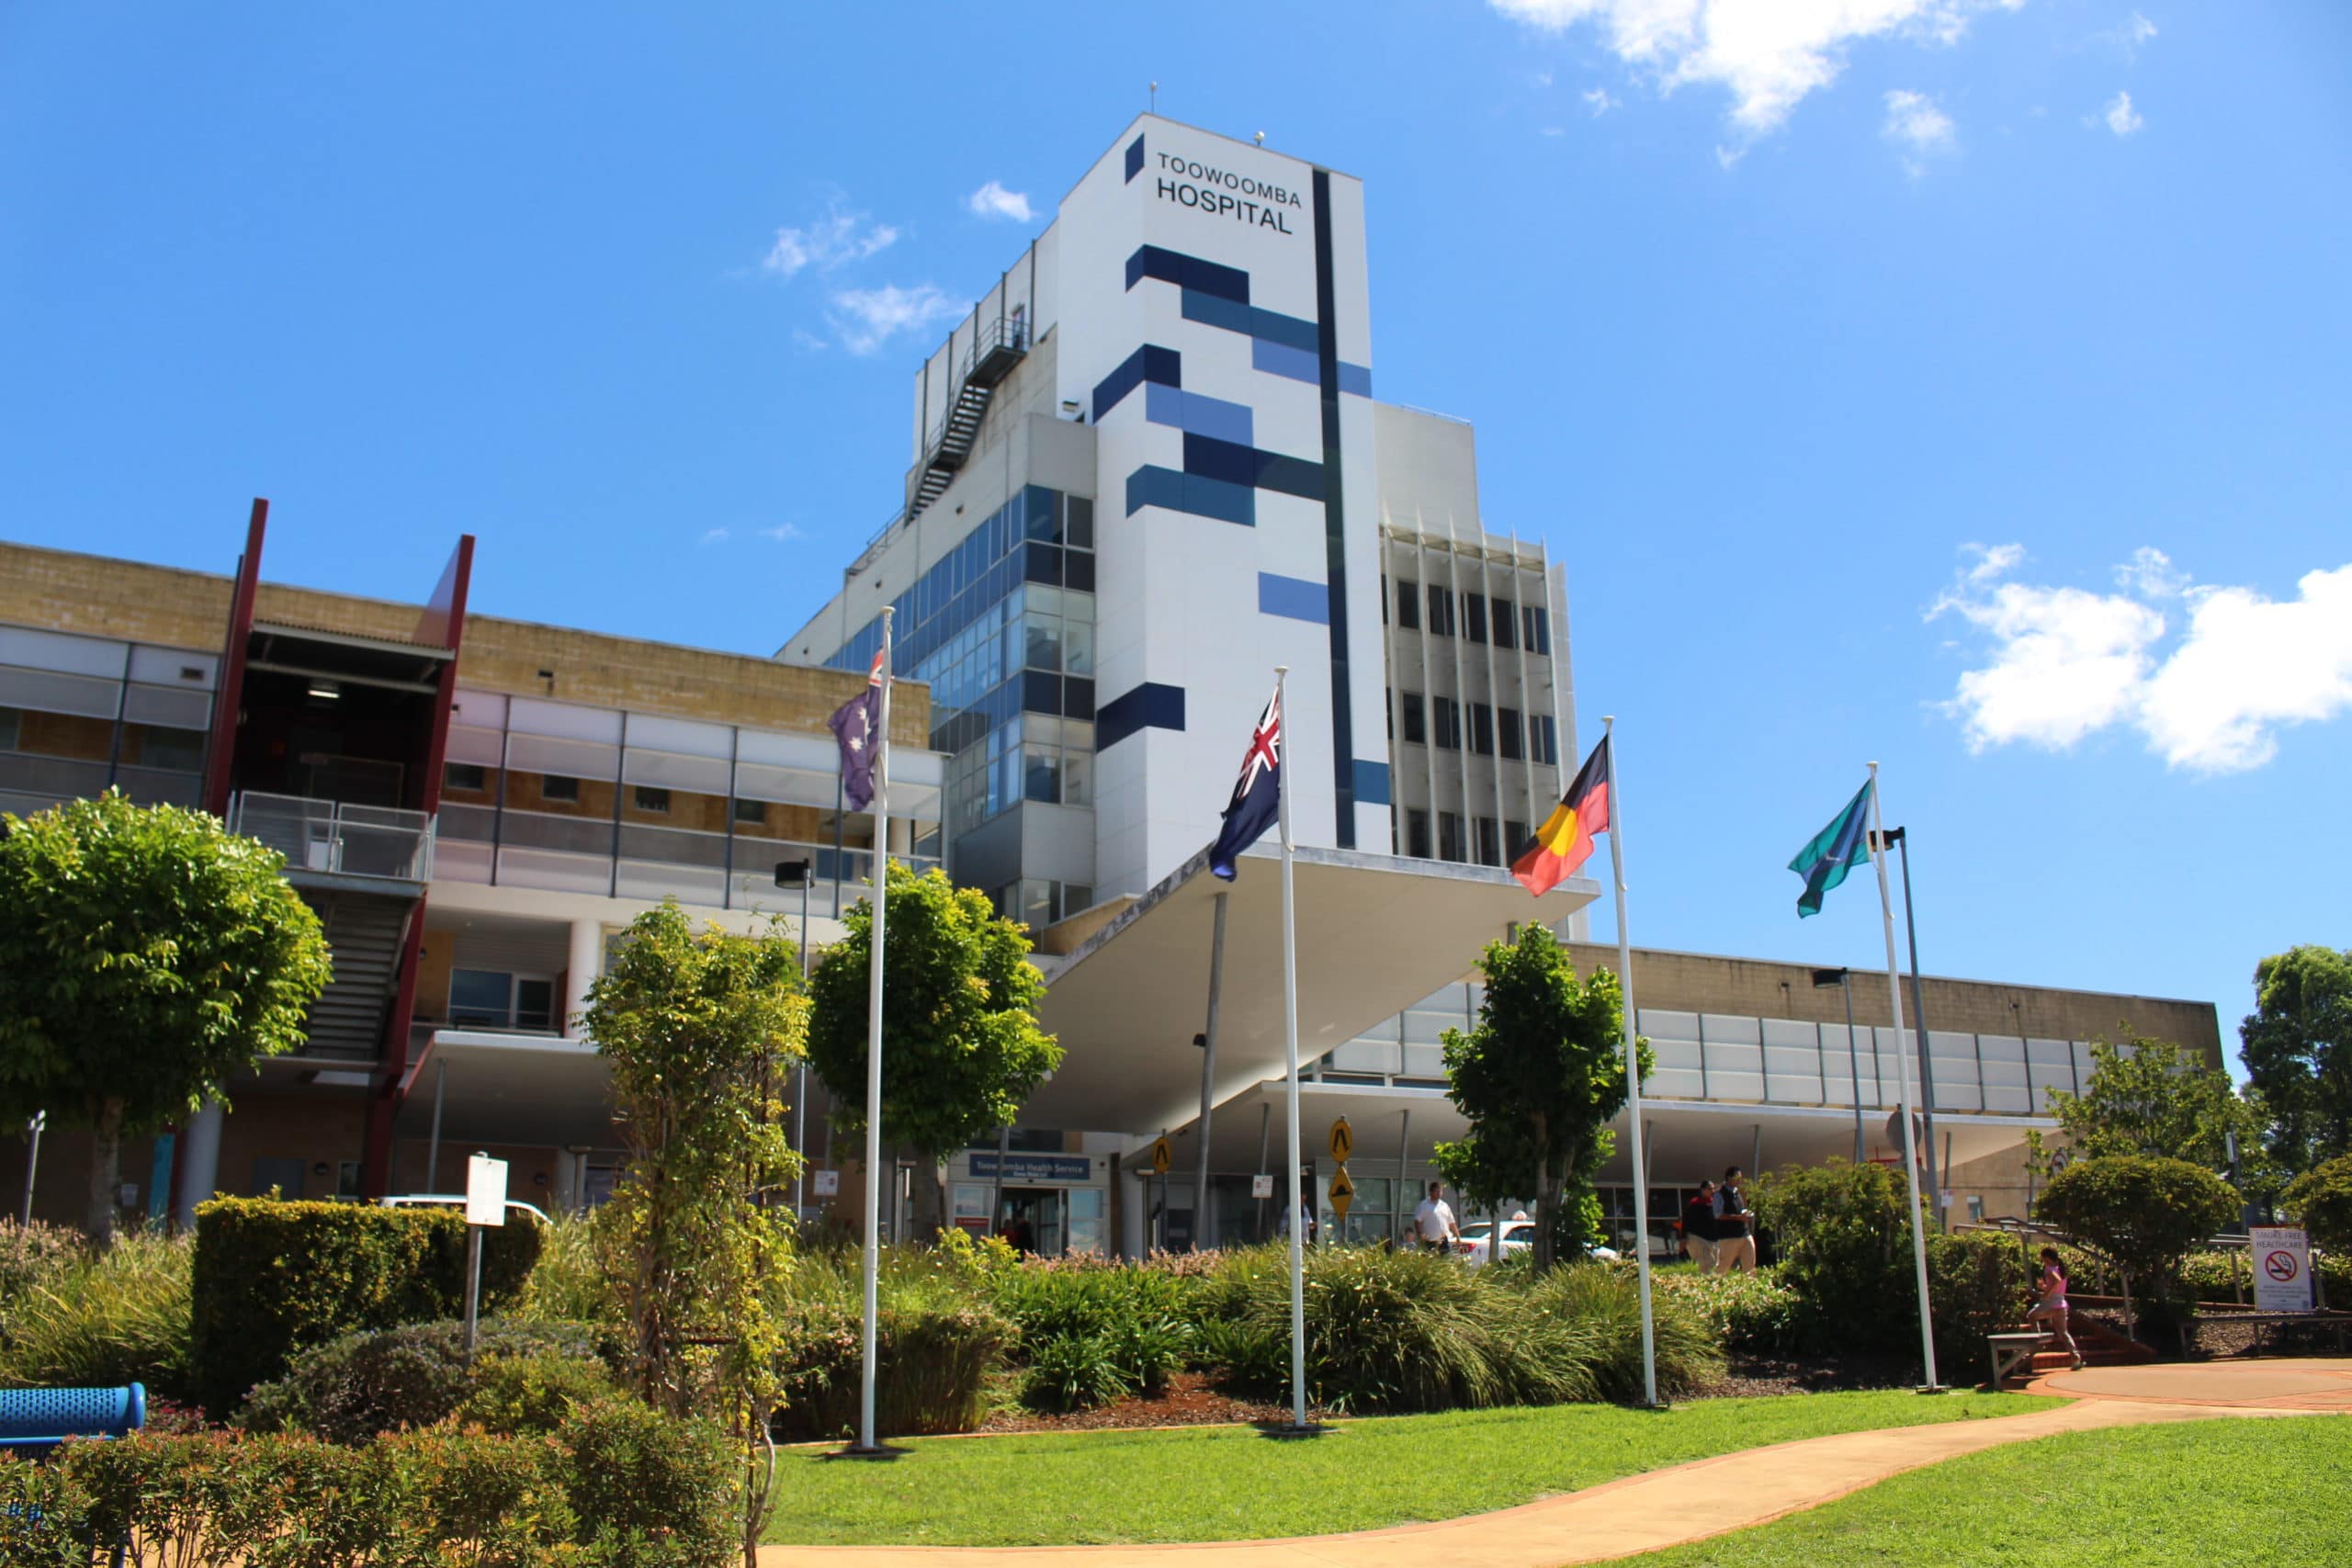
While on the Darling Downs, the local HHS has seen more than $42 million wiped.
It comes as Queensland records the worst ambulance ramping in the country, emergency departments are overwhelmed and elective surgery waitlists surge.
Leader of the Opposition David Crisafulli said the cuts were the equivalent of a brand new Queensland hospital.
“Patients and paramedics have a right to feel betrayed,” Mr Crisafulli said.
“The State Government has been asking doctors, nurses and allied health staff to do more with less.
“Let’s be clear, these aren’t dividends. These are cuts.
“When you strip $1.3 billion, is it any wonder Queensland has the worst ambulance ramping in the country, dire elective surgery waitlists and emergency departments bursting at the seams.
“The State Government needs to accept there is a health crisis of their own making.”
Shadow Health Minister Ros Bates said for seven years the State Government had destroyed the health system and now they wanted another seven years to fix it.
“While our exhausted frontline staff are working double shifts, the State Government is swindling money out of the health system,” Ms Bates said.
“These cutbacks are savage.
“If the Government has been asking our hospitals to make these savings, where has the money gone?
“Why hasn’t the government been investing this money in our broken mental health system, or expanding hospital capacity?
“As a registered nurse of 40 years and a former hospital administrator, I know that patient care must be the top priority rather than cutting funding from a system under immense strain.”
| PRODUCTIVITY AND EFFICIENCY DIVIDENDS | |||
| Hospital & Health Services | Total Efficiency Dividends Since 2015/16 | Total Productivity Dividends Since 2015/16 | Combined TOTAL |
| Cairns and Hinterland | $22,702,430 | $40,017,000 | $62,719,430 |
| Central Queensland | $18,094,074 | $45,041,000 | $63,135,074 |
| Central West | $790,557 | $0 | $790,557 |
| Children’s Health Queensland | $28,528,427 | $50,230,000 | $78,758,427 |
| Darling Downs | $11,915,363 | $30,224,000 | $42,139,363 |
| Gold Coast | $54,188,201 | $136,890,000 | $191,078,201 |
| Mackay | $9,106,956 | $22,772,000 | $31,878,956 |
| Metro North | $64,289,503 | $165,108,000 | $229,397,503 |
| Metro South | $79,130,550 | $231,652,000 | $310,782,550 |
| North West | $5,672,614 | $6,750,000 | $12,422,614 |
| South West | $1,523,353 | $0 | $1,523,353 |
| Sunshine Coast | $44,933,769 | $79,112,000 | $124,045,769 |
| Torres and Cape | $2,241,205 | $0 | $2,241,205 |
| Townsville | $27,808,500 | $66,392,000 | $94,200,500 |
| Wide Bay | $17,380,669 | $37,166,000 | $54,546,669 |
| West Moreton | $16,714,868 | $49,382,000 | $66,096,868 |
| TOTAL | $405,021,039 | $960,736,000 | $1,365,757,039 |
· Productivity Dividend QON: /tableOffice/questionsAnswers/2022/516-2022.pdf
· Efficiency Dividend QON: /tableoffice/questionsanswers/2021/1260-2021.pdf
To stay up to date click here to follow my social media.

